Good day once more. Another activity has been done but this time, I fail to get the best image. I did not know why I was not able to get a good image but at least I have done the activity. I was a bit disappointed for this activity. I became lazy yet again. Anyway, let me start with the production of binary images with two dots in it.
After a long and tiring day, I was not able to finish the whole activity on time. I will grade myself with 4 points since I was not able to finish the activity I was supposed to do by tonight. Thank you..
- Convolution Theorem
In this activity, an image was generated with two dots(one pixel each) symmetric to the y-axis. Figure 1 shows the FT of the two dots. As observed, the modulus of the FT of the image has given a series of vertical lines that also form circular pattern. After this, the two dots were given given a varying radius. Figure 2 shows the FT of the varying dots. The pattern seen are similar with the two dots only that as the radius increases, the pattern shrinks.
Figure 1. Two dots

Figure 2. increasing radius of two dots.
Next is to replace the dots with a Gaussian spots. Shown by figure 3 and its corresponding FT. It is quite tricky but easy to apply. The center is just shifted and all the rest follows. It is then observed that the FT is enlarged as the variance increases.

Figure 3. Gaussian spot
After that, a 200x200 array was done and 10 random dots were placed on it and FT was applied, showed in figure 4. Most of the dots seen in the image are still seen on the FT.

Figure 4. Random dots.
Next thing is another array with equally spaced 1's. This is shown in figure 5. It is observed that with increasing space, the number of dots seen in the Fourier plane decreases.

Figure 5. Equally spaced dots. - Fingerprint: Ridge Enhancement
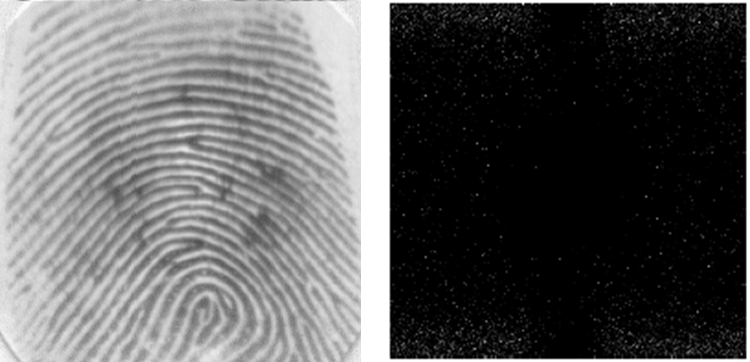
Figure 6 shows the original fingerprint(left) and its FT(right). I have used a pattern that will easily capture the edges of the ridges. With this filter, the ridges should be enhanced.

Figure 6. Fingerprint and its FT. Taken from the PDF file
- Lunar Landing Scanned Pictures: Line Removal
Next is to remove the lines seen in the image of figure 7(left). A filter was created that will remove the lines. The lines are of low frequency along the y-axis so the filter used is a horizontal line that blocks out the low frequency in the y-axis and high frequency in the x-axis.

Figure 7. Original image(left) and processed image(right)
- Canvas Weave Modelling and Removal
This is the last part of the activity. I was not able to remove the dots seen around the image that is why the original image is only seen.

Figure 8


After a long and tiring day, I was not able to finish the whole activity on time. I will grade myself with 4 points since I was not able to finish the activity I was supposed to do by tonight. Thank you..
No comments:
Post a Comment